Articles
Technology and Multiple Points of View
- By Bryan Lapidus, FP&A
- Published: 12/10/2020

Finance’s response to volatility and unpredictability is to maintain multiple points of view of what can happen in the future. With an information flow that is always on and always accelerating, a challenge for the planning function is to match near real-team data flows with a long-term view of value creation by continuously aligning corporate strategy, planning and resource allocation.
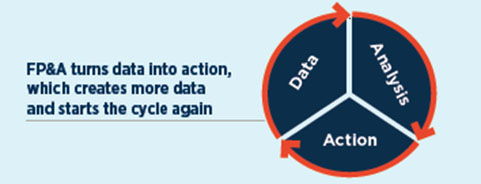
Financial planning and analysis (FP&A) takes data, analyzes it to create information and prepares a business entity for action. The “action” may be driving decisions, investment allocations, operational alignment or questions that identify additional areas of research. That, in turn, produces more information—and the process repeats. The more often a company can cycle through the data-analysis-action wheel, the more opportunities it will have to read the market, accelerate, decelerate and recalibrate.

The 2020 FP&A survey examines FP&A’s abilities in these areas by focusing on the quality and accessibility of the data, and the planning and analytical tools available to examine and find meaning in that data to help drive actions. Here are a few highlights of what we found.
DEMAND FOR FORECASTING IS UP
2020 has been a busy year for FP&A. With facts, assumptions and expectations changing constantly, FP&A produced more forecasts and scenarios than ever before. The majority of companies reforecasts monthly or more often. The frequency of forecasts that are run daily, weekly and monthly increased during the year, and this is expected to continue into 2021. FP&A showed that it was able to meet this increased demand, while management appreciated the updated outlooks and came to expect them as part of the regular process.

FP&A needs to execute the forecasts quickly, since it is completing them more often, both on routine schedules and based on unscheduled events. Failure to do this implies
that forecasting will consume organizations’ time and limit FP&A’s effectiveness to focusing only on a single point of view, the forecast.
AFP FinNext Virtual 2021
Discover what’s next in the FP&A industry through FinNext’s educational sessions, networking and solutions providers. Connect with your peers and discover their success stories at this event created exclusively for you. Learn More
SYSTEM INVESTMENT IS HIGH IN SOME AREAS
Two-thirds of survey respondents (64%) use a dedicated planning system. FP&A planning platforms can be robust tools that integrate inputs from many sources, create a set of data that is mutually recognized and trusted, allow for multiple versions and reporting and scale with the business. This high rate of platform adoption is encouraging—when implemented and executed well, it can accelerate the data analysis-action cycle relative to working exclusively on spreadsheets.
A particularly bright spot in the survey results is the high level of automation in reporting. This is a critical win for FP&A because manual reporting has the potential to be incredibly time consuming and prone to error. Automated reporting can add tremendous value to business partners, while freeing FP&A to do more analysis (which could be of even more value to business partners).
SO WHY ARE WE STILL SO FRUSTRATED?
FP&A can visualize what a data-centric future looks like but does not feel equipped to achieve it. The following are key areas where capability lags.
The data is not flowing. FP&A spends half its forecast time in data gathering and data preparation, about the same as a decade ago. This is consistent with findings reported in 2019 as well as in 2010. This may be fine for data exploration analytical projects, by forecasting should be more routinized if it is going to happen more frequently.
The software is not flexible. Yes, two-thirds of planners are using a dedicated planning tool, but 97% of them still use spreadsheets for planning on a daily, weekly or monthly basis.
People are not using the tools to max potential. The downfall of agile implementations is that people get their immediate need met and then stop; new people don’t fully learn the tool, or our business partners are not using the “finance” planning tool.
People are not digital first. A recent article from MIT/Sloan Management Review, “Why Culture Is the Greatest Barrier to Data Success,” states that “the greatest barrier to data success today is business culture, not lagging technology.”
WHERE WE ARE, WHERE WE’RE GOING
The following image emerges from the survey. Operational and financial data are washing all around the company, and there exist islands of automation that capture and harness the data to create information, analysis and action. In frustrating cases, these islands are connected by “rowboats”—spreadsheets, manual process workarounds, and ad hoc solutions that have become the norm. In other cases, the islands are connected by “rope bridges”—some savvy, enterprising person has built reporting cubes, tables, or connectors that move the data to complete task. Ideally, we will get to “major bridges”—the Golden Gate or GW bridges that have were built around data as an asset to the company, a roadmap for data and systems that tie finance and operations together. This will help to balance the multiple points of view simultaneously: to react rapidly and reforecast quickly with recent data, while planning strategically for the long term.
Download the 2020 AFP FP&A Survey: The Technology and Data Platform Supporting Finance Decisions, underwritten by Workday.
PARTNER CONTENT:
Copyright © 2025 Association for Financial Professionals, Inc.
All rights reserved.


