Articles
Add “Change Measurement” to Your “Change Management” to Increase Success
- By Ed Cook
- Published: 5/22/2023

Focusing only on the technical aspects of change within an organization can result in a new system that operates precisely the way it should — and is still a failure.
Successful change management requires that we consider the human factor, engaging stakeholders as they move through the various stages of adoption. The opportunity to measure engagement at each stage provides valuable feedback to understand the degree to which your users are buying into the program.
The AFP FP&A Case Study series is designed to help you build up key FP&A capabilities and skills by sharing examples of how leading practitioners have tackled challenges in their work and the lessons learned.
Presented at an AFP Advisory Council meeting, this case study contains elements that are anonymized to maintain privacy and encourage open discussion.
INSIGHT: IN PREPARING FOR A CHANGE MANAGEMENT EVENT, UNDERSTAND THE USER JOURNEY TO ENGAGE APPROPRIATELY AT EACH STAGE; FOLLOW UP EACH PHASE WITH METRICS TO KNOW HOW WELL ALL ARE PROCEEDING TOWARD ADOPTION.
| Company Size: | Large |
| Industry: | Financial Services |
| Geography: | North America |
| FP&A Maturity Model: | Organizational Design |
Organizational design: Structure matches maturity. FP&A is a recognized department and discipline within finance with a defined value proposition. The organization is forward-looking and embraces both strategic and operational change.
Background: General Information About the Company
The subject of this case study is a major U.S. financial services company that initiated an effort to upgrade its highly customized compensation module by adding a new module to the existing Enterprise Resource Planning (ERP) software.
Several factors played into the outcome of this upgrade:
- The system was seasonally utilized. Once a year, in January, 10,000 managers made decisions regarding 50,000 employees’ base salaries and bonuses. Because they were not using the standing system often, they were not very familiar with it.
- The managers did not have prior experience with the new system, so the implementation team was faced with the challenge of quickly training 10,000 people of various backgrounds and technical abilities.
- It was very important that the team get it right the first time, both from a human perspective and a legal one, because the system directly dealt with the employees’ compensation – a sensitive topic for 50,000 people!
- The team was also under a serious time crunch: They only had two weeks to successfully make the upgrade in order to onboard the managers and complete the payroll reviews.
- The prior rollout was messy, leading to user mistrust of large IT projects.
I was brought in as a change management consultant to help the company implement the compensation module.
Challenge: The Work or Difficulty FP&A Had to Address
The new compensation model was going to be an addition to the ERP that was implemented three years prior. The team assumed that the system would be so intuitive that, once it was turned on, everyone would simply know how to use it. The reality was quite a bit different. People struggled and the help desk became overwhelmed with calls. As a result, the reputation of the system dramatically declined and became a joke within the company.
Now, management decided to replace the highly customized, separate compensation tools with a module that would be integrated with the original ERP system. There were two primary challenges the team had to overcome in order to make this a success:
- The technical issue: The legacy system required a lot of manual manipulation to make it work after all of the customizations it had undergone.
- The human factor: Given the history and reputation enveloping the compensation module, there was quite a bit of concern and very little trust in the capability of the new (old) compensation system.
Approach: How FP&A Addressed the Challenge
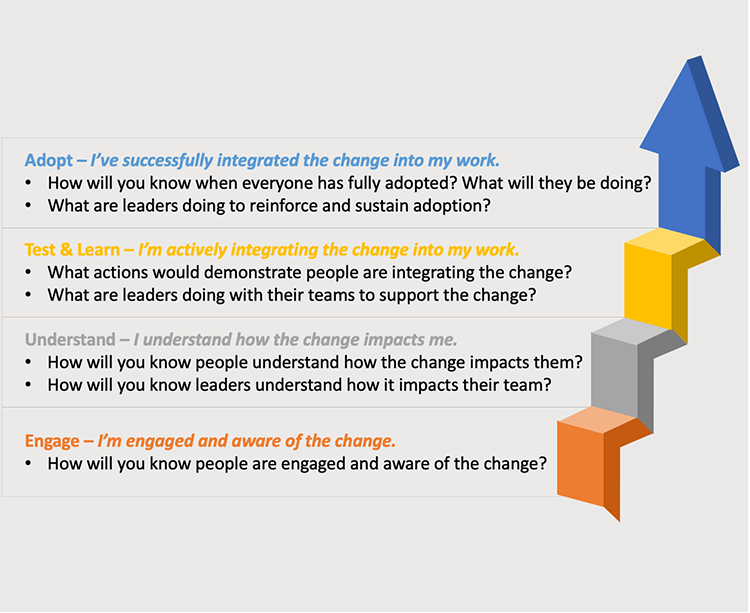
Using a robust change-management approach, the team deployed a four-phase description of the user journey, then designed metrics around each step. The key to being able to follow through is to know which of the four phases you are in. In each phase, there are activities and metrics that make you aware of areas that are failing to move along, should there be any, and the adaptive moves you can make.
The following is a framework of the types of metrics to consider, as well as examples that align with the phases:
During each of the phases, there are three levels of metrics to consider:
- Self-reported metrics. These are the things people say about themselves, the subjective metrics. Survey questions should be about how people feel about the change that is coming. For example: Do you understand what is going on? Do you feel ready for the change?
- Observable metrics. These include what people actually see or hear that is happening. While observable metrics are objective, they tend to also be qualitative. They do not produce very specific answers, but they can point to increasing or decreasing trends.
- Existing company metrics. These are the operational or outcome metrics as to why this change was undertaken. Existing company metrics are quantitative and tied to operational performance items you want to improve upon.
The following are examples of the metrics as aligned to the four phases:
Engage — People are engaged and aware of the change.
Key consideration: How will you know if people are engaged and aware of the change?
Sample Metrics:
- Self-reported: “I know that we will use a new system for comp decisions.”
- Observable: Finance reports, managers are asking questions.
- Existing company: None.
Activities:
About seven months before testing, the consultant initiated check-in meetings with the project team, a group of ambassadors who were spread out across the company. The consultant also provided users with demonstrations of the new system and created recordings of the process to build awareness.
Understand – People understand how the change impacts them.
Key considerations: How will you know that people understand how the change impacts them? How will you know leaders understand how it impacts their teams?
Sample Metrics:
- Self-reported: “I know how to get the needed training for comp decisions.”
- Observable: None.
- Existing company: Managers are completing the training.
Activities:
As the technical moved into a build phase, users completed quarterly preparedness check-in surveys. Information gathered from the surveys was then shared with the managers and executives to help them understand where they were in the process as a company and within their individual teams, allowing for changes in engagement plans where needed.
Education materials were circulated to a pilot group, so changes could be made, if necessary, before distributing the materials companywide.
Test and Learn – People are actively integrating the change into their work.
Key considerations: What actions would demonstrate people are integrating the change? What are leaders doing with their teams to support the change?
Sample Metrics:
- Self-reported: “I feel ready for the coming compensation cycle.”
- Observable: Managers are in the learning area completing a trial decision.
- Existing company: Help desk volume remains within normal limits.
Activities:
As they entered the test and learn phase, the survey questions were geared toward learning about peoples’ levels of competence with the new system. The consultants asked: How do you feel about it? Have you completed the available training courses?
Adopt – People have successfully integrated the change into their work.
Key considerations: How will you know when everyone has fully adopted the new system? What will they be doing? What are leaders doing to reinforce and sustain adoption?
Sample Metrics:
- Self-reported: “I feel comfortable that I correctly completed the comp decisions.”
- Observable: VPs report that managers are more comfortable than last year.
- Existing company: Comp decisions completed on time.
Activities:
The activities focused on the post-rollout period. The finance team checked for correctness and quality for 30 days. Following those 30 days was the post-performance cycle, during which they asked people to reflect on how the process was going while it was still fresh in their minds, in case the team missed anything in the previous phases. This is also the point at which they started building lessons learned into the work for the following year.
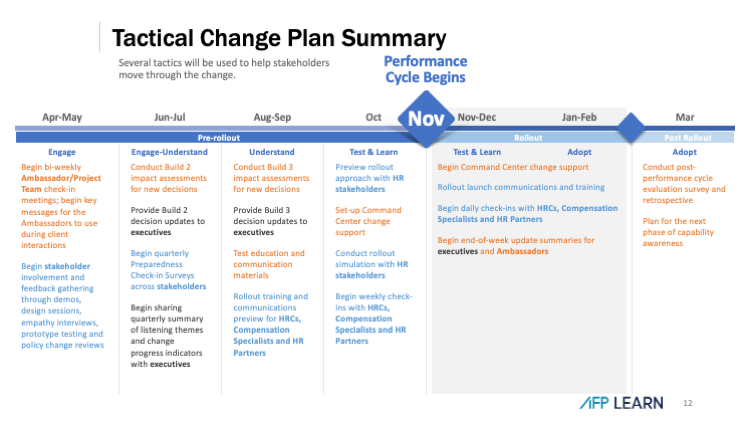
Tactical Change Plan Summary
The Tactical Change Plan Summary provides a timeline of the distinct change management actions taken by each of the three groups involved in the process: the project team, the managers who will need to operate the system, and the executives.
Outcome: What Came of FP&A's Efforts and What Was Learned
The effort was a success. The managers’ compensation decision completion rate of jumped from 30% to 90%, and by week two, 100% of the compensation decisions were completed.
The experience demonstrated that even if a new tool is technically sound, success derives from having people use the tool effectively. This can be supported with a change-management approach, such as the four-phase process outlined above, combined with metrics to monitor how people are handling the change and receive feedback along the way.
Discussion: Q&A Among Council Members
In our transformation journey, we used KPIs such as the return on investment from those changes, or identifying the key benefits for each department or each stakeholder. We also have financial KPIs such as financial ROI based on time savings, and non-financial KPIs such as having happy users or enhancing the experience of the users, or things that lead to employee retention.
A: Those kinds of KPIs are asking, are we getting the outcomes we had planned when we put the business case together? I think those are great. You're going beyond the basic business metrics around revenue and costs. What I'm suggesting here, and hoping to encourage all of you to do, is to also think about the metrics through the change process itself to achieve the outcomes you want.
In this case, if we hadn't considered the phases and measured our status at each phase, if we had instead waited until we got to the implementation period, we wouldn't have been able to course-correct if things were going poorly. We are trying to pull things forward in time, so we know whether or not we're making the progress we need.
How do you manage resistance?
A: There will be resistance. The best you can do is try to figure out from where it’s coming and when. That's where the metrics come in. It might be people aren't going to training, or nobody asks any questions when we get the group together because they don't want to talk about it. What are some ways to get around that? You have to figure out what's driving the resistance. The metrics have to be very specific to the event itself, to whatever the change is. The reason(s) for the resistance may be different for different elements within the company because different people have different reasons for feeling resistant. It will need to be customized to the people and the particular change, but taking the time to do that can be really valuable.
Build up key FP&A capabilities and skills with AFP’s FP&A Maturity Model, a roadmap to help you and your team become leading practitioners.
Copyright © 2025 Association for Financial Professionals, Inc.
All rights reserved.

